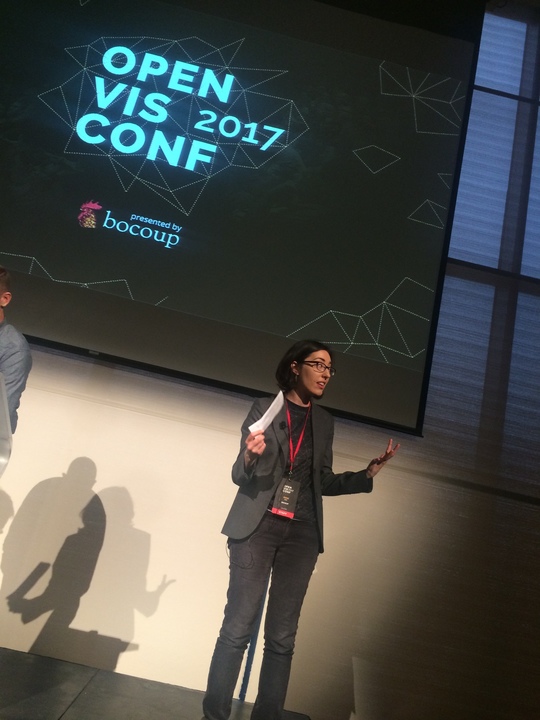
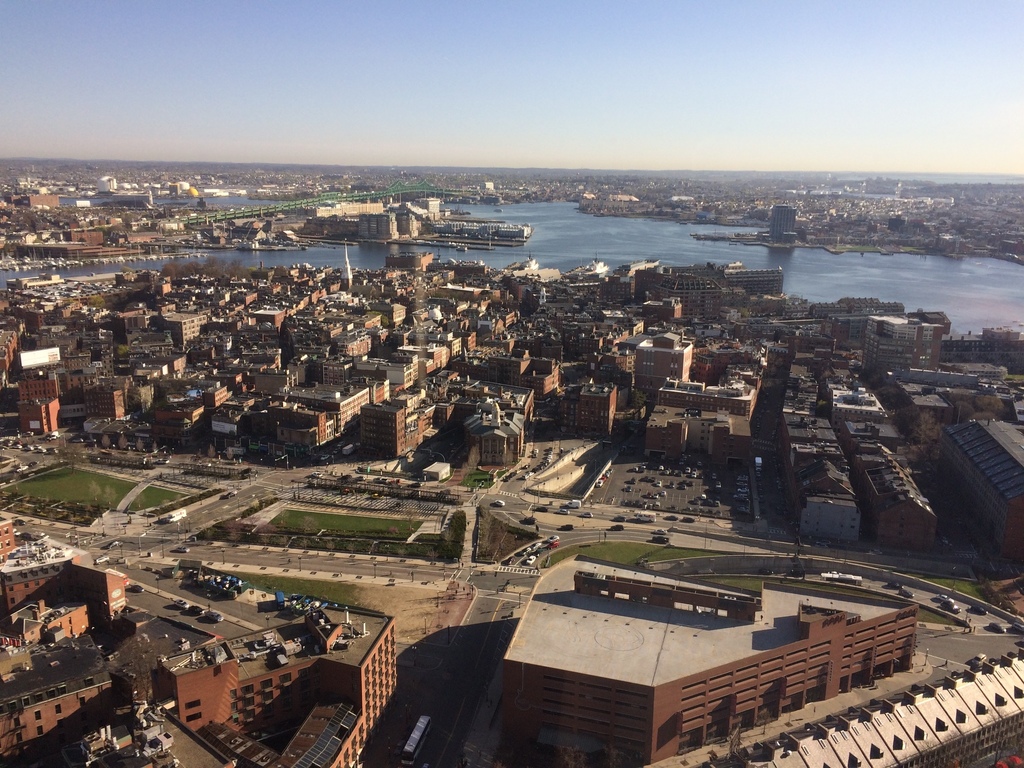
Today was the last day of the incredible OpenVisConf in Boston. I’m still digesting everything from the two days of talks, but here is my general plan.
1. Taking screenshots of my work in progress. So many of the talks had in-progress shots that showed their design and thought process and it made everything easier to follow.
2. Do more medium sized dataviz projects. I might not be able to crank out one every month, but I should do more smaller viz projects like I used to.
3. Turn my network graphs into scatterplots
4. Do at least one map project this year
5. Figure out what REGL is before the author is killed by a volcano
6. Try out WTFCSV
7. Build a particle viz for support tickets with Trello data.
8. Do more of those “draw the chart” tests that the New York Times puts out.
9. Use simulation.find() in D3!
10. Learn more about veroni
11. Do some text data mining on Shakespeare using tidytext
12. Put chart colors/styles in our styleguide
13. See if I can use Vega-Lite to generate all possible chart types at once for a data set, such as automobile deaths.
14. Make some generative art based on http://bengarvey.com/bounce/gravity.html
15. Build some color palettes using Colorgorical
BONUS 16. Hope I get into the d3.express beta
Leave a Reply